This is just a quick reminder on how to deal with the frustration of
far-from-perfect ggplot2 images in rmarkdown and related formats (e.g. bookdown, blogdown, xaringan).
The issue
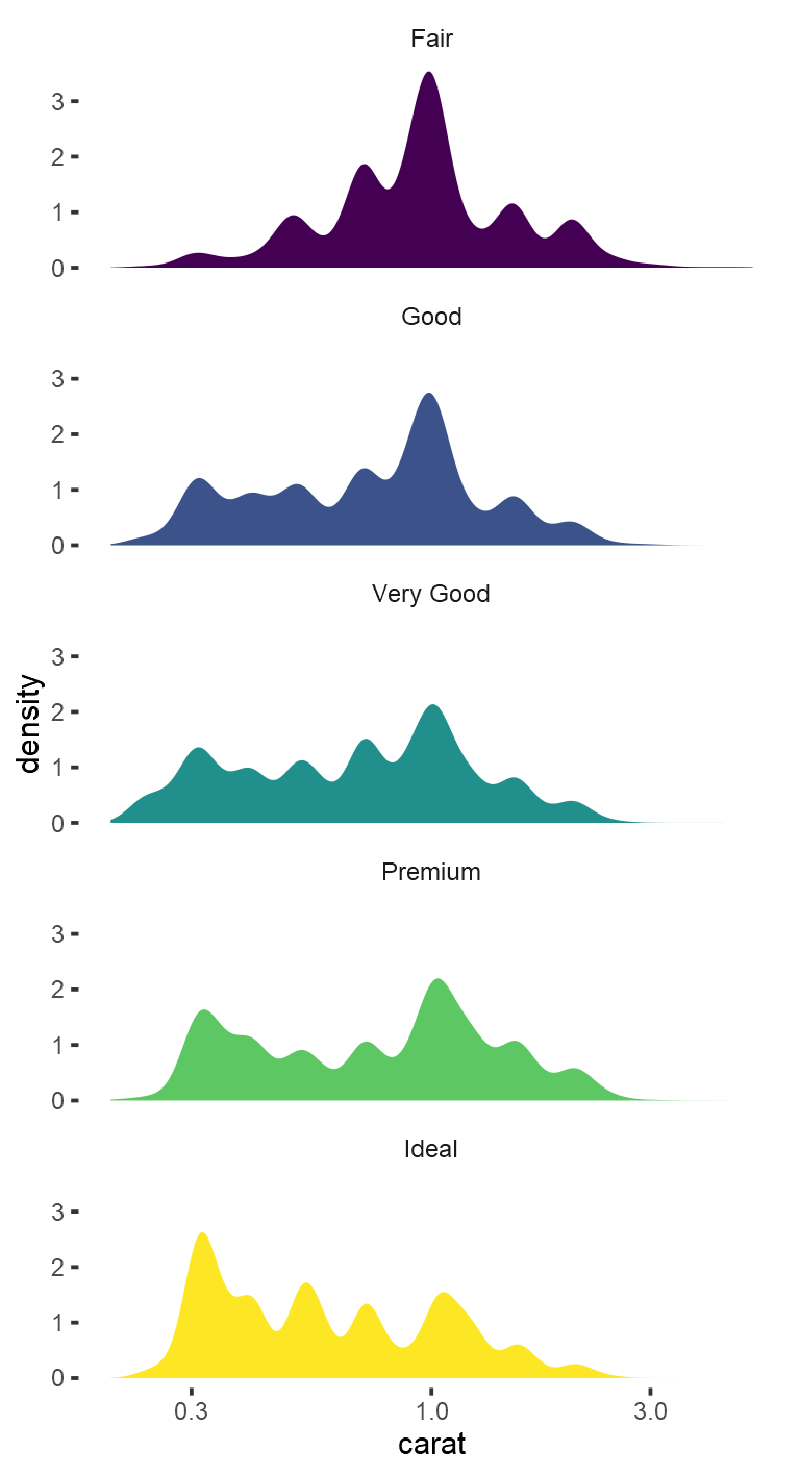
Motivation is this.
diamonds %>%
  ggplot(aes(x = carat, fill = cut)) +
  geom_density(color = NA) +
  facet_wrap(vars(cut), ncol = 1) +
  scale_x_log10() +
  ggthemes::theme_tufte() +
  theme(legend.position = "none")

The plot probably does not make sense at all. And I did not spend a second thinking about its design, color palette, etc. But this plot illustrates two frequent issues:
- Need to fix aspect-ratio and overall, deal with the shape and size of the plot.
- Image-quality is really far from perfect. Just compare it with the same plot as rendered in RStudio Viewer (I am not in the mood to show the comparison here, though).
Towards a better plot
Useful refs
Just some links to follow, when you need to brush up on these things
- The canonical / authoritative source
- Well, the rmarkdown cookbook of course
- Tips and tricks about all this. Check it out
- EDIT: Making the case to use
cairo - EDIT: A recent and useful post discussing these issues
- And an old SO question that repeatedly pop up in my search
- A frequently-seen post with details on exporting plots to meet a journal standards
- Good reference on how to deal with fonts, …, if and when you want to go out of the standard
Fixing aspect ratio
I just follow the authoritative advice and set defaults for fig.width,
fig.asp and out.width. Now in the specific chunk y modify the fig.asp.
Usually, the trick is just to render the plot in RStudio Viewer and adjust there
until satisfied and then right click -> Inspect and see the width and height and bring it here as fig.asp=891/483.
This can result in horrible things, like here.
diamonds %>%
  ggplot(aes(x = carat, fill = cut)) +
  geom_density(color = NA) +
  facet_wrap(vars(cut), ncol = 1) +
  scale_x_log10() +
  ggthemes::theme_tufte() +
  theme(legend.position = "none")

So you should also probably need to adjust the fig.width to make the text size
as you want. And as seen above, the image quality can also be compromised, so
you probably need to fiddle with fig.retina and/or dev.
Changing dev
dev="CairoPNG" is one alternative that can help you out, still using PNG
files. You need to have either cairo capabilities() or the Cairo package.
Alternatively, you can use dev="svg" for potentially even better quality. But
it is vector-based graphics, so it could lead to very big files (e.g. scatter
plots with millions of points).
dev=“CairoPNG”
diamonds %>%
  ggplot(aes(x = carat, fill = cut)) +
  geom_density(color = NA) +
  facet_wrap(vars(cut), ncol = 1) +
  scale_x_log10() +
  ggthemes::theme_tufte() +
  theme(legend.position = "none")

dev=“svg”
diamonds %>%
  ggplot(aes(x = carat, fill = cut)) +
  geom_density(color = NA) +
  facet_wrap(vars(cut), ncol = 1) +
  scale_x_log10() +
  ggthemes::theme_tufte() +
  theme(legend.position = "none")
fig.retina
fig.retina=1
diamonds %>%
  ggplot(aes(x = carat, fill = cut)) +
  geom_density(color = NA) +
  facet_wrap(vars(cut), ncol = 1) +
  scale_x_log10() +
  ggthemes::theme_tufte() +
  theme(legend.position = "none")

fig.retina=2
diamonds %>%
  ggplot(aes(x = carat, fill = cut)) +
  geom_density(color = NA) +
  facet_wrap(vars(cut), ncol = 1) +
  scale_x_log10() +
  ggthemes::theme_tufte() +
  theme(legend.position = "none")

fig.retina=3
diamonds %>%
  ggplot(aes(x = carat, fill = cut)) +
  geom_density(color = NA) +
  facet_wrap(vars(cut), ncol = 1) +
  scale_x_log10() +
  ggthemes::theme_tufte() +
  theme(legend.position = "none")

fig.retina=4
diamonds %>%
  ggplot(aes(x = carat, fill = cut)) +
  geom_density(color = NA) +
  facet_wrap(vars(cut), ncol = 1) +
  scale_x_log10() +
  ggthemes::theme_tufte() +
  theme(legend.position = "none")

fig.retina=5
diamonds %>%
  ggplot(aes(x = carat, fill = cut)) +
  geom_density(color = NA) +
  facet_wrap(vars(cut), ncol = 1) +
  scale_x_log10() +
  ggthemes::theme_tufte() +
  theme(legend.position = "none")

