In the previous post I ended up with a naive model and explored the performance
metrics available in scikit-learn. Now let’s move on to exploring how to
assess feature importance.
But first let me fit again the naive model to work with.
deaths_2016 = pd.read_csv(
    "../../Python/deaths_eevv/data_src/Nofetal_2016.txt",
    sep="\t", encoding="WINDOWS-1252"
)

deaths_2016["MUNI"] = deaths_2016["COD_DPTO"]*1000 + deaths_2016["COD_MUNIC"]
deaths_2016 = deaths_2016.loc[deaths_2016["PMAN_MUER"] != 3]
deaths_2016 = deaths_2016[[
    "PMAN_MUER", "MES", "HORA", "MINUTOS", "SEXO", "EST_CIVIL", "GRU_ED2",
    "NIVEL_EDU", "IDPERTET", "SEG_SOCIAL", "MUNI", "A_DEFUN"
]]
deaths_2016 = deaths_2016.dropna()

X_all = deaths_2016.drop("PMAN_MUER", "columns")
y_all = deaths_2016.loc[:, "PMAN_MUER"]
from sklearn.model_selection import train_test_split
X_train, X_test, y_train, y_test = train_test_split(
    X_all, y_all, test_size=0.3, random_state=0
)
from sklearn.ensemble import RandomForestClassifier
rforestclf = RandomForestClassifier(n_estimators=100, n_jobs=-1, random_state=0)
with TicToc(): # TicToc just to time it
    rforestclf.fit(X_train, y_train)
with TicToc(): # TicToc just to time it
    y_pred = rforestclf.predict(X_test)
with TicToc(): # TicToc just to time it
    y_prob = rforestclf.predict_proba(X_test)
Elapsed time is 11.412477 seconds. Elapsed time is 1.160469 seconds. Elapsed time is 0.908408 seconds.
Feature importance
If you look at how to get feature importance from a Random Forest Classifier using scikit learn, the simplest way you find is probably this (and probably the first one you find):
list(zip(X_train, rforestclf.feature_importances_))
[('MES', 0.06911498633512159),
 ('HORA', 0.17768605045599462),
 ('MINUTOS', 0.18260674193071805),
 ('SEXO', 0.03443579171156089),
 ('EST_CIVIL', 0.03496689065798194),
 ('GRU_ED2', 0.2075589984707883),
 ('NIVEL_EDU', 0.04939604073736049),
 ('IDPERTET', 0.019784497814925785),
 ('SEG_SOCIAL', 0.06939200067145147),
 ('MUNI', 0.11717053097885965),
 ('A_DEFUN', 0.03788747023523727)]
Ok, that works. But …
- it is ugly
- not sorted (although you can fix that with one line)
- does not show how feature importance varies in the forest
So let’s try a simple plot using matplotlib, adapting Chris Albon’s code
here
import numpy as np
# need to sort the features by importance and get the names of the features
indices = np.argsort(rforestclf.feature_importances_)[::1]
names = [X_train.columns[i] for i in indices]
import matplotlib.pyplot as plt
plt.figure()
plt.barh(range(X_train.shape[1]), rforestclf.feature_importances_[indices])
plt.yticks(range(X_train.shape[1]), names)
plt.show()
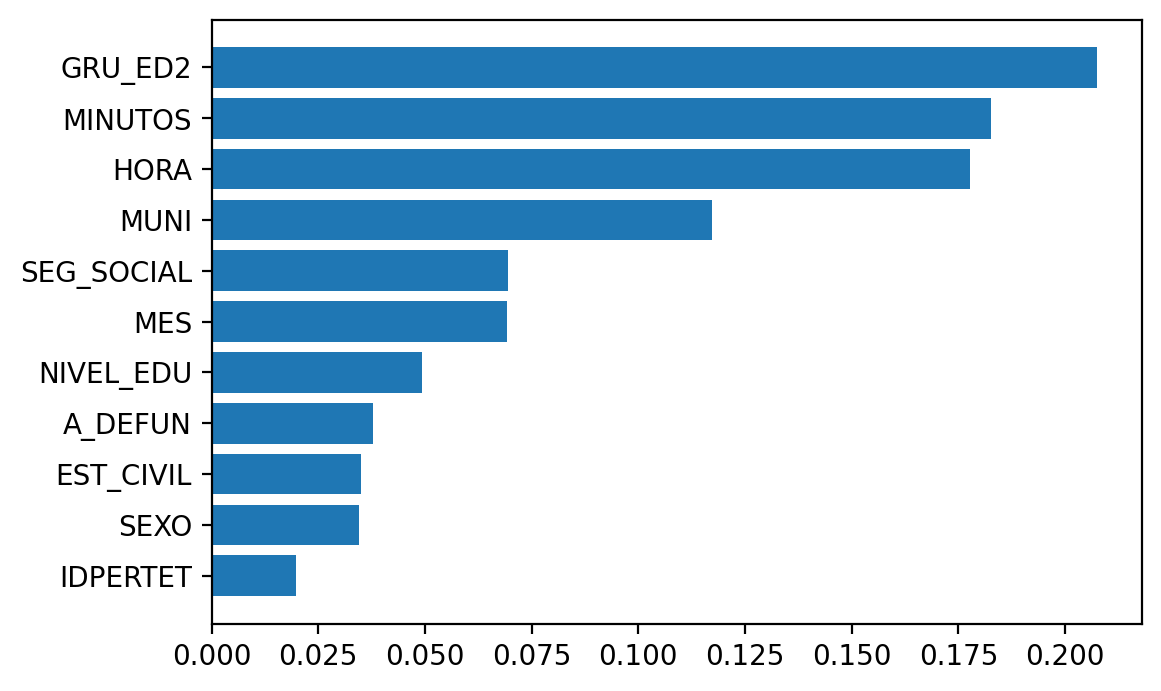
Ok, that’s better. I just keep missing taking a look at the variability in the
forest. scikit-learn has this example,
where they plot feature importance in a bar plot and add inter-tree variability
as error bars/lines. So let’s take that as an inspiration and see what I come
up with. Basically I do not like these bar plots topped with error lines, so
I will try something different.
First, a joy plot
indices = np.argsort(rforestclf.feature_importances_)[::-1]
names = [X_train.columns[i] for i in indices]

import joypy
importance_variability = [tree.feature_importances_ for tree in rforestclf.estimators_]
importance_variability = pd.DataFrame(np.stack(importance_variability))
importance_variability = importance_variability[indices]
importance_variability.columns = names
%matplotlib inline
fig, axes = joypy.joyplot(importance_variability)
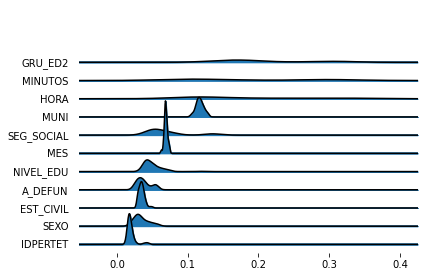
Ok, now you have a sense of feature importance variability in the forest. But it seems a lot for the most important variables (which is expected, see Robin Genuer, Jean-Michel Poggi, Christine Tuleau-Malot. Variable selection using Random Forests. Pattern Recognition Letters, Elsevier, 2010, 31 (14), pp.2225-2236. ffhal-00755489f). However, there might also be some over-smoothing in this kernel density estimate. So let’s see also a box plot and perhaps a violin plot.
import seaborn as sns
importance_variability = importance_variability.melt(var_name='feature',
                                                     value_name='importance')
ax = sns.violinplot(x="importance", y="feature", data=importance_variability,
                    scale="width")

Yeah, I think this more accurately reflects what is going on.
row_p = pd.crosstab(y_test, X_test["SEXO"], margins=True, normalize="index")
col_p = pd.crosstab(y_test, X_test["SEXO"], margins=True, normalize="columns")
men_violent_rowp = "{0:.1%}".format(row_p[1][2])
wom_violent_rowp = "{0:.1%}".format(row_p[2][2])
men_violent_colp = "{0:.1%}".format(col_p[1][2])
wom_violent_colp = "{0:.1%}".format(col_p[2][2])
Yet, there is something odd with these feature importances. It does not seem correct that sex has such a low importance in predicting whether it was a volent death. Indeed, if you look at the raw numbers, being men or women seems pretty important. Although overall men die slightly more than women, they are certainly over-represented in the violent deaths. Among all violent deaths, men account for ‘84.3%’ and women only ‘15.6%’. Similarly, among all dead men, ‘19.4%’ died violently while only ‘4.4%’ of the women had a violent death. Here the tables:
pd.crosstab(y_test, X_test["SEXO"], margins=True)
SEXO           1      2  3    All
PMAN_MUER
1          29623  28402  0  58025
2           7115   1318  3   8436
All        36738  29720  3  66461
pd.crosstab(y_test, X_test["SEXO"], margins=True, normalize="index")
SEXO              1         2         3
PMAN_MUER
1          0.510521  0.489479  0.000000
2          0.843409  0.156235  0.000356
All        0.552775  0.447180  0.000045
pd.crosstab(y_test, X_test["SEXO"], margins=True, normalize="columns")
SEXO              1         2    3       All
PMAN_MUER
1          0.806331  0.955653  0.0  0.873068
2          0.193669  0.044347  1.0  0.126932
Now, why sex appears to have such a low importance in the model?
The answer is most probably because a well-known issue in this way of measuring
feature importance. So far I used scikit-learn’s feature_importances_,
that in this case correspond to an average of the importances in each tree in
the forest, which are “computed as the (normalized) total reduction of the
criterion brought by that feature. It is also known as the Gini importance.".
This is also known as mean decrease in impurity.
Unfortunately, this measure has been shown to be “affected by the number of
categories and scale of measurement of the predictor variables, which are no
direct indicators of the true importance of the variable”,
so variables with many categories will have artificially higher importance than
low cardinality variables. And this could well be the case here. Sex has only
three possible values (man, woman, unknown), while other features like
municipality may have over a thousand unique values.
Another issue with this method is correlated predictors. It would tend to highlight one of the predictors with high importance, leaving the other one with low importance (intuitively because after one predictor has been used, the other one has only residual predictive power).
An alternative that does not have such issues is permutation importance a.k.a mean decrease accuracy. The idea is that you randomly shuffle one predictor at a time, and observe how much decreases the model accuracy in each tree, and average over all the forest (hence, mean decrease accuracy).
It seems scikit-learn does not provide any function to calculate permutation
importance. But there are a number of options out there. EDIT: July 2019,
apparently now scikit-learn will also provide methods to calculate
permutation importance. At least they have merged
that into the master repository. I haven’t tried it yet, though
eli5 library provides permutation importance methods for scikit-learn
estimators. It’s straightforward: one-liner and you get the permutation
importance. Also, it’s cool you can tell the library which scoring measure
to use. In this case it would be important due to the imbalance problem we saw
earlier. The default scoring measure is accuracy and we already checked that it
could be overly optimistic. Hence, it could also be misleading in the case of
feature importance. Let’s obtain feature importances based on several
scoring measures.
import eli5
from eli5.sklearn import PermutationImportance

# sorted(metrics.SCORERS.keys())
with TicToc(): # TicToc just to time it
    perm1 = PermutationImportance(
        estimator=rforestclf, scoring="accuracy", n_iter=5, random_state=0
    ).fit(X_test, y_test)
with TicToc(): # TicToc just to time it
    perm2 = PermutationImportance(
        estimator=rforestclf, scoring="balanced_accuracy", n_iter=5, random_state=0
    ).fit(X_test, y_test)
with TicToc(): # TicToc just to time it
    perm3 = PermutationImportance(
        estimator=rforestclf, scoring="jaccard_weighted", n_iter=5, random_state=0
    ).fit(X_test, y_test)
with TicToc(): # TicToc just to time it
    perm4 = PermutationImportance(
        estimator=rforestclf, scoring="roc_auc", n_iter=5, random_state=0
    ).fit(X_test, y_test)
with TicToc(): # TicToc just to time it
    perm5 = PermutationImportance(
        estimator=rforestclf, scoring="recall", n_iter=5, random_state=0
    ).fit(X_test, y_test)
Elapsed time is 46.401880 seconds.
Elapsed time is 48.777953 seconds.
Elapsed time is 45.476373 seconds.
Elapsed time is 45.923903 seconds.
Elapsed time is 42.132071 seconds.
eli5 provides a visualization method, to display a colored table.
perm1_html = eli5.show_weights(perm1, feature_names = X_train.columns.tolist())
perm2_html = eli5.show_weights(perm2, feature_names = X_train.columns.tolist())
perm3_html = eli5.show_weights(perm3, feature_names = X_train.columns.tolist())
perm4_html = eli5.show_weights(perm4, feature_names = X_train.columns.tolist())
perm5_html = eli5.show_weights(perm5, feature_names = X_train.columns.tolist())
display_markdown(perm1_html.data, raw=True)
display_markdown(perm2_html.data, raw=True)
display_markdown(perm3_html.data, raw=True)
display_markdown(perm4_html.data, raw=True)
display_markdown(perm5_html.data, raw=True)
<style>
table.eli5-weights tr:hover {
    filter: brightness(85%);
}
<table class="eli5-weights eli5-feature-importances" style="border-collapse: collapse; border: none; margin-top: 0em; table-layout: auto;">
<thead>
<tr style="border: none;">
<th style="padding: 0 1em 0 0.5em; text-align: right; border: none;">Weight</th>
<th style="padding: 0 0.5em 0 0.5em; text-align: left; border: none;">Feature</th>
</tr>
</thead>
<tbody>
<tr style="background-color: hsl(120, 100.00%, 80.00%); border: none;">
<td style="padding: 0 1em 0 0.5em; text-align: right; border: none;">
0.0354
± 0.0012
</td>
<td style="padding: 0 0.5em 0 0.5em; text-align: left; border: none;">
GRU_ED2
</td>
</tr>
<tr style="background-color: hsl(120, 100.00%, 80.27%); border: none;">
<td style="padding: 0 1em 0 0.5em; text-align: right; border: none;">
0.0347
± 0.0011
</td>
<td style="padding: 0 0.5em 0 0.5em; text-align: left; border: none;">
MINUTOS
</td>
</tr>
<tr style="background-color: hsl(120, 100.00%, 89.50%); border: none;">
<td style="padding: 0 1em 0 0.5em; text-align: right; border: none;">
0.0141
± 0.0010
</td>
<td style="padding: 0 0.5em 0 0.5em; text-align: left; border: none;">
SEG_SOCIAL
</td>
</tr>
<tr style="background-color: hsl(120, 100.00%, 90.46%); border: none;">
<td style="padding: 0 1em 0 0.5em; text-align: right; border: none;">
0.0123
± 0.0005
</td>
<td style="padding: 0 0.5em 0 0.5em; text-align: left; border: none;">
HORA
</td>
</tr>
<tr style="background-color: hsl(120, 100.00%, 92.47%); border: none;">
<td style="padding: 0 1em 0 0.5em; text-align: right; border: none;">
0.0088
± 0.0006
</td>
<td style="padding: 0 0.5em 0 0.5em; text-align: left; border: none;">
SEXO
</td>
</tr>
<tr style="background-color: hsl(120, 100.00%, 93.53%); border: none;">
<td style="padding: 0 1em 0 0.5em; text-align: right; border: none;">
0.0071
± 0.0003
</td>
<td style="padding: 0 0.5em 0 0.5em; text-align: left; border: none;">
A_DEFUN
</td>
</tr>
<tr style="background-color: hsl(120, 100.00%, 93.85%); border: none;">
<td style="padding: 0 1em 0 0.5em; text-align: right; border: none;">
0.0066
± 0.0007
</td>
<td style="padding: 0 0.5em 0 0.5em; text-align: left; border: none;">
MUNI
</td>
</tr>
<tr style="background-color: hsl(120, 100.00%, 94.29%); border: none;">
<td style="padding: 0 1em 0 0.5em; text-align: right; border: none;">
0.0059
± 0.0007
</td>
<td style="padding: 0 0.5em 0 0.5em; text-align: left; border: none;">
NIVEL_EDU
</td>
</tr>
<tr style="background-color: hsl(120, 100.00%, 95.21%); border: none;">
<td style="padding: 0 1em 0 0.5em; text-align: right; border: none;">
0.0046
± 0.0002
</td>
<td style="padding: 0 0.5em 0 0.5em; text-align: left; border: none;">
IDPERTET
</td>
</tr>
<tr style="background-color: hsl(120, 100.00%, 97.57%); border: none;">
<td style="padding: 0 1em 0 0.5em; text-align: right; border: none;">
0.0017
± 0.0004
</td>
<td style="padding: 0 0.5em 0 0.5em; text-align: left; border: none;">
EST_CIVIL
</td>
</tr>
<tr style="background-color: hsl(120, 100.00%, 99.21%); border: none;">
<td style="padding: 0 1em 0 0.5em; text-align: right; border: none;">
0.0003
± 0.0009
</td>
<td style="padding: 0 0.5em 0 0.5em; text-align: left; border: none;">
MES
</td>
</tr>
</tbody>
<style>
table.eli5-weights tr:hover {
    filter: brightness(85%);
}
<table class="eli5-weights eli5-feature-importances" style="border-collapse: collapse; border: none; margin-top: 0em; table-layout: auto;">
<thead>
<tr style="border: none;">
<th style="padding: 0 1em 0 0.5em; text-align: right; border: none;">Weight</th>
<th style="padding: 0 0.5em 0 0.5em; text-align: left; border: none;">Feature</th>
</tr>
</thead>
<tbody>
<tr style="background-color: hsl(120, 100.00%, 80.00%); border: none;">
<td style="padding: 0 1em 0 0.5em; text-align: right; border: none;">
0.1201
± 0.0024
</td>
<td style="padding: 0 0.5em 0 0.5em; text-align: left; border: none;">
GRU_ED2
</td>
</tr>
<tr style="background-color: hsl(120, 100.00%, 91.61%); border: none;">
<td style="padding: 0 1em 0 0.5em; text-align: right; border: none;">
0.0347
± 0.0024
</td>
<td style="padding: 0 0.5em 0 0.5em; text-align: left; border: none;">
SEXO
</td>
</tr>
<tr style="background-color: hsl(120, 100.00%, 92.34%); border: none;">
<td style="padding: 0 1em 0 0.5em; text-align: right; border: none;">
0.0305
± 0.0020
</td>
<td style="padding: 0 0.5em 0 0.5em; text-align: left; border: none;">
MINUTOS
</td>
</tr>
<tr style="background-color: hsl(120, 100.00%, 92.66%); border: none;">
<td style="padding: 0 1em 0 0.5em; text-align: right; border: none;">
0.0287
± 0.0011
</td>
<td style="padding: 0 0.5em 0 0.5em; text-align: left; border: none;">
SEG_SOCIAL
</td>
</tr>
<tr style="background-color: hsl(120, 100.00%, 93.33%); border: none;">
<td style="padding: 0 1em 0 0.5em; text-align: right; border: none;">
0.0250
± 0.0016
</td>
<td style="padding: 0 0.5em 0 0.5em; text-align: left; border: none;">
MUNI
</td>
</tr>
<tr style="background-color: hsl(120, 100.00%, 93.68%); border: none;">
<td style="padding: 0 1em 0 0.5em; text-align: right; border: none;">
0.0232
± 0.0015
</td>
<td style="padding: 0 0.5em 0 0.5em; text-align: left; border: none;">
NIVEL_EDU
</td>
</tr>
<tr style="background-color: hsl(120, 100.00%, 94.80%); border: none;">
<td style="padding: 0 1em 0 0.5em; text-align: right; border: none;">
0.0175
± 0.0009
</td>
<td style="padding: 0 0.5em 0 0.5em; text-align: left; border: none;">
A_DEFUN
</td>
</tr>
<tr style="background-color: hsl(120, 100.00%, 95.48%); border: none;">
<td style="padding: 0 1em 0 0.5em; text-align: right; border: none;">
0.0143
± 0.0020
</td>
<td style="padding: 0 0.5em 0 0.5em; text-align: left; border: none;">
HORA
</td>
</tr>
<tr style="background-color: hsl(120, 100.00%, 96.15%); border: none;">
<td style="padding: 0 1em 0 0.5em; text-align: right; border: none;">
0.0114
± 0.0013
</td>
<td style="padding: 0 0.5em 0 0.5em; text-align: left; border: none;">
EST_CIVIL
</td>
</tr>
<tr style="background-color: hsl(120, 100.00%, 97.29%); border: none;">
<td style="padding: 0 1em 0 0.5em; text-align: right; border: none;">
0.0069
± 0.0007
</td>
<td style="padding: 0 0.5em 0 0.5em; text-align: left; border: none;">
IDPERTET
</td>
</tr>
<tr style="background-color: hsl(120, 100.00%, 99.06%); border: none;">
<td style="padding: 0 1em 0 0.5em; text-align: right; border: none;">
0.0015
± 0.0017
</td>
<td style="padding: 0 0.5em 0 0.5em; text-align: left; border: none;">
MES
</td>
</tr>
</tbody>
<style>
table.eli5-weights tr:hover {
    filter: brightness(85%);
}
<table class="eli5-weights eli5-feature-importances" style="border-collapse: collapse; border: none; margin-top: 0em; table-layout: auto;">
<thead>
<tr style="border: none;">
<th style="padding: 0 1em 0 0.5em; text-align: right; border: none;">Weight</th>
<th style="padding: 0 0.5em 0 0.5em; text-align: left; border: none;">Feature</th>
</tr>
</thead>
<tbody>
<tr style="background-color: hsl(120, 100.00%, 80.00%); border: none;">
<td style="padding: 0 1em 0 0.5em; text-align: right; border: none;">
0.0591
± 0.0016
</td>
<td style="padding: 0 0.5em 0 0.5em; text-align: left; border: none;">
GRU_ED2
</td>
</tr>
<tr style="background-color: hsl(120, 100.00%, 82.53%); border: none;">
<td style="padding: 0 1em 0 0.5em; text-align: right; border: none;">
0.0488
± 0.0016
</td>
<td style="padding: 0 0.5em 0 0.5em; text-align: left; border: none;">
MINUTOS
</td>
</tr>
<tr style="background-color: hsl(120, 100.00%, 89.95%); border: none;">
<td style="padding: 0 1em 0 0.5em; text-align: right; border: none;">
0.0221
± 0.0014
</td>
<td style="padding: 0 0.5em 0 0.5em; text-align: left; border: none;">
SEG_SOCIAL
</td>
</tr>
<tr style="background-color: hsl(120, 100.00%, 91.18%); border: none;">
<td style="padding: 0 1em 0 0.5em; text-align: right; border: none;">
0.0184
± 0.0008
</td>
<td style="padding: 0 0.5em 0 0.5em; text-align: left; border: none;">
HORA
</td>
</tr>
<tr style="background-color: hsl(120, 100.00%, 92.15%); border: none;">
<td style="padding: 0 1em 0 0.5em; text-align: right; border: none;">
0.0155
± 0.0010
</td>
<td style="padding: 0 0.5em 0 0.5em; text-align: left; border: none;">
SEXO
</td>
</tr>
<tr style="background-color: hsl(120, 100.00%, 93.62%); border: none;">
<td style="padding: 0 1em 0 0.5em; text-align: right; border: none;">
0.0116
± 0.0010
</td>
<td style="padding: 0 0.5em 0 0.5em; text-align: left; border: none;">
MUNI
</td>
</tr>
<tr style="background-color: hsl(120, 100.00%, 93.63%); border: none;">
<td style="padding: 0 1em 0 0.5em; text-align: right; border: none;">
0.0115
± 0.0005
</td>
<td style="padding: 0 0.5em 0 0.5em; text-align: left; border: none;">
A_DEFUN
</td>
</tr>
<tr style="background-color: hsl(120, 100.00%, 94.05%); border: none;">
<td style="padding: 0 1em 0 0.5em; text-align: right; border: none;">
0.0105
± 0.0011
</td>
<td style="padding: 0 0.5em 0 0.5em; text-align: left; border: none;">
NIVEL_EDU
</td>
</tr>
<tr style="background-color: hsl(120, 100.00%, 95.46%); border: none;">
<td style="padding: 0 1em 0 0.5em; text-align: right; border: none;">
0.0071
± 0.0004
</td>
<td style="padding: 0 0.5em 0 0.5em; text-align: left; border: none;">
IDPERTET
</td>
</tr>
<tr style="background-color: hsl(120, 100.00%, 97.23%); border: none;">
<td style="padding: 0 1em 0 0.5em; text-align: right; border: none;">
0.0035
± 0.0007
</td>
<td style="padding: 0 0.5em 0 0.5em; text-align: left; border: none;">
EST_CIVIL
</td>
</tr>
<tr style="background-color: hsl(120, 100.00%, 99.16%); border: none;">
<td style="padding: 0 1em 0 0.5em; text-align: right; border: none;">
0.0006
± 0.0014
</td>
<td style="padding: 0 0.5em 0 0.5em; text-align: left; border: none;">
MES
</td>
</tr>
</tbody>
<style>
table.eli5-weights tr:hover {
    filter: brightness(85%);
}
<table class="eli5-weights eli5-feature-importances" style="border-collapse: collapse; border: none; margin-top: 0em; table-layout: auto;">
<thead>
<tr style="border: none;">
<th style="padding: 0 1em 0 0.5em; text-align: right; border: none;">Weight</th>
<th style="padding: 0 0.5em 0 0.5em; text-align: left; border: none;">Feature</th>
</tr>
</thead>
<tbody>
<tr style="background-color: hsl(120, 100.00%, 80.00%); border: none;">
<td style="padding: 0 1em 0 0.5em; text-align: right; border: none;">
0.1052
± 0.0039
</td>
<td style="padding: 0 0.5em 0 0.5em; text-align: left; border: none;">
GRU_ED2
</td>
</tr>
<tr style="background-color: hsl(120, 100.00%, 94.63%); border: none;">
<td style="padding: 0 1em 0 0.5em; text-align: right; border: none;">
0.0161
± 0.0008
</td>
<td style="padding: 0 0.5em 0 0.5em; text-align: left; border: none;">
SEG_SOCIAL
</td>
</tr>
<tr style="background-color: hsl(120, 100.00%, 94.79%); border: none;">
<td style="padding: 0 1em 0 0.5em; text-align: right; border: none;">
0.0154
± 0.0010
</td>
<td style="padding: 0 0.5em 0 0.5em; text-align: left; border: none;">
MINUTOS
</td>
</tr>
<tr style="background-color: hsl(120, 100.00%, 95.11%); border: none;">
<td style="padding: 0 1em 0 0.5em; text-align: right; border: none;">
0.0140
± 0.0024
</td>
<td style="padding: 0 0.5em 0 0.5em; text-align: left; border: none;">
SEXO
</td>
</tr>
<tr style="background-color: hsl(120, 100.00%, 95.35%); border: none;">
<td style="padding: 0 1em 0 0.5em; text-align: right; border: none;">
0.0131
± 0.0012
</td>
<td style="padding: 0 0.5em 0 0.5em; text-align: left; border: none;">
HORA
</td>
</tr>
<tr style="background-color: hsl(120, 100.00%, 95.41%); border: none;">
<td style="padding: 0 1em 0 0.5em; text-align: right; border: none;">
0.0129
± 0.0005
</td>
<td style="padding: 0 0.5em 0 0.5em; text-align: left; border: none;">
MUNI
</td>
</tr>
<tr style="background-color: hsl(120, 100.00%, 95.48%); border: none;">
<td style="padding: 0 1em 0 0.5em; text-align: right; border: none;">
0.0126
± 0.0016
</td>
<td style="padding: 0 0.5em 0 0.5em; text-align: left; border: none;">
NIVEL_EDU
</td>
</tr>
<tr style="background-color: hsl(120, 100.00%, 96.56%); border: none;">
<td style="padding: 0 1em 0 0.5em; text-align: right; border: none;">
0.0085
± 0.0011
</td>
<td style="padding: 0 0.5em 0 0.5em; text-align: left; border: none;">
A_DEFUN
</td>
</tr>
<tr style="background-color: hsl(120, 100.00%, 98.37%); border: none;">
<td style="padding: 0 1em 0 0.5em; text-align: right; border: none;">
0.0029
± 0.0003
</td>
<td style="padding: 0 0.5em 0 0.5em; text-align: left; border: none;">
IDPERTET
</td>
</tr>
<tr style="background-color: hsl(120, 100.00%, 98.52%); border: none;">
<td style="padding: 0 1em 0 0.5em; text-align: right; border: none;">
0.0025
± 0.0009
</td>
<td style="padding: 0 0.5em 0 0.5em; text-align: left; border: none;">
EST_CIVIL
</td>
</tr>
<tr style="background-color: hsl(0, 100.00%, 99.44%); border: none;">
<td style="padding: 0 1em 0 0.5em; text-align: right; border: none;">
-0.0006
± 0.0014
</td>
<td style="padding: 0 0.5em 0 0.5em; text-align: left; border: none;">
MES
</td>
</tr>
</tbody>
<style>
table.eli5-weights tr:hover {
    filter: brightness(85%);
}
<table class="eli5-weights eli5-feature-importances" style="border-collapse: collapse; border: none; margin-top: 0em; table-layout: auto;">
<thead>
<tr style="border: none;">
<th style="padding: 0 1em 0 0.5em; text-align: right; border: none;">Weight</th>
<th style="padding: 0 0.5em 0 0.5em; text-align: left; border: none;">Feature</th>
</tr>
</thead>
<tbody>
<tr style="background-color: hsl(120, 100.00%, 80.00%); border: none;">
<td style="padding: 0 1em 0 0.5em; text-align: right; border: none;">
0.0361
± 0.0008
</td>
<td style="padding: 0 0.5em 0 0.5em; text-align: left; border: none;">
MINUTOS
</td>
</tr>
<tr style="background-color: hsl(120, 100.00%, 90.97%); border: none;">
<td style="padding: 0 1em 0 0.5em; text-align: right; border: none;">
0.0116
± 0.0005
</td>
<td style="padding: 0 0.5em 0 0.5em; text-align: left; border: none;">
HORA
</td>
</tr>
<tr style="background-color: hsl(120, 100.00%, 92.37%); border: none;">
<td style="padding: 0 1em 0 0.5em; text-align: right; border: none;">
0.0091
± 0.0010
</td>
<td style="padding: 0 0.5em 0 0.5em; text-align: left; border: none;">
SEG_SOCIAL
</td>
</tr>
<tr style="background-color: hsl(120, 100.00%, 93.94%); border: none;">
<td style="padding: 0 1em 0 0.5em; text-align: right; border: none;">
0.0066
± 0.0010
</td>
<td style="padding: 0 0.5em 0 0.5em; text-align: left; border: none;">
GRU_ED2
</td>
</tr>
<tr style="background-color: hsl(120, 100.00%, 95.86%); border: none;">
<td style="padding: 0 1em 0 0.5em; text-align: right; border: none;">
0.0038
± 0.0003
</td>
<td style="padding: 0 0.5em 0 0.5em; text-align: left; border: none;">
IDPERTET
</td>
</tr>
<tr style="background-color: hsl(120, 100.00%, 96.09%); border: none;">
<td style="padding: 0 1em 0 0.5em; text-align: right; border: none;">
0.0035
± 0.0002
</td>
<td style="padding: 0 0.5em 0 0.5em; text-align: left; border: none;">
A_DEFUN
</td>
</tr>
<tr style="background-color: hsl(120, 100.00%, 99.32%); border: none;">
<td style="padding: 0 1em 0 0.5em; text-align: right; border: none;">
0.0003
± 0.0004
</td>
<td style="padding: 0 0.5em 0 0.5em; text-align: left; border: none;">
MUNI
</td>
</tr>
<tr style="background-color: hsl(120, 100.00%, 99.87%); border: none;">
<td style="padding: 0 1em 0 0.5em; text-align: right; border: none;">
0.0000
± 0.0010
</td>
<td style="padding: 0 0.5em 0 0.5em; text-align: left; border: none;">
NIVEL_EDU
</td>
</tr>
<tr style="background-color: hsl(0, 100.00%, 99.81%); border: none;">
<td style="padding: 0 1em 0 0.5em; text-align: right; border: none;">
-0.0000
± 0.0007
</td>
<td style="padding: 0 0.5em 0 0.5em; text-align: left; border: none;">
MES
</td>
</tr>
<tr style="background-color: hsl(0, 100.00%, 99.74%); border: none;">
<td style="padding: 0 1em 0 0.5em; text-align: right; border: none;">
-0.0001
± 0.0003
</td>
<td style="padding: 0 0.5em 0 0.5em; text-align: left; border: none;">
SEXO
</td>
</tr>
<tr style="background-color: hsl(0, 100.00%, 97.80%); border: none;">
<td style="padding: 0 1em 0 0.5em; text-align: right; border: none;">
-0.0015
± 0.0004
</td>
<td style="padding: 0 0.5em 0 0.5em; text-align: left; border: none;">
EST_CIVIL
</td>
</tr>
</tbody>
That’s cool. You can quickly spot the most important variables and have a sense
of which are less important. Yet, IMHO you can convey the variability more
effectively through a plot. eli5 gives you the std. So let’s use it.
import numpy as np
import matplotlib.pyplot as plt

# Rearrange so the features are sorted by importance in the plot
indices = np.argsort(perm2.feature_importances_)[::1]
names = [X_train.columns[i] for i in indices]

# Plot them
%matplotlib inline
plt.figure()
plt.errorbar(
    x=perm2.feature_importances_[indices],
    y=names,
    xerr=perm2.feature_importances_std_[indices]*2,
    fmt='o'
)
plt.show()
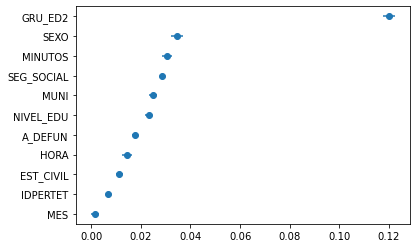
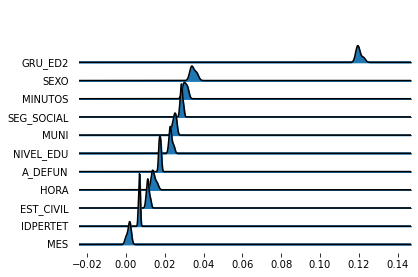
Ok, but what about all the distribution? eli5 also gives you results_,
“A list of score decreases for all experiments”. Let’s replicate here the
joy- and violin-plots I did earlier.
# Rearrange so the features are sorted by importance in the plot
indices = np.argsort(perm2.feature_importances_)[::-1]
names = [X_train.columns[i] for i in indices]

import joypy
importance_variability = perm2.results_
importance_variability = pd.DataFrame(np.stack(importance_variability))
importance_variability = importance_variability[indices]
importance_variability.columns = names
%matplotlib inline
fig, axes = joypy.joyplot(importance_variability)
import seaborn as sns
importance_variability = importance_variability.melt(var_name='feature',
                                                     value_name='importance')
ax = sns.violinplot(x="importance", y="feature", data=importance_variability,
                    scale="width")
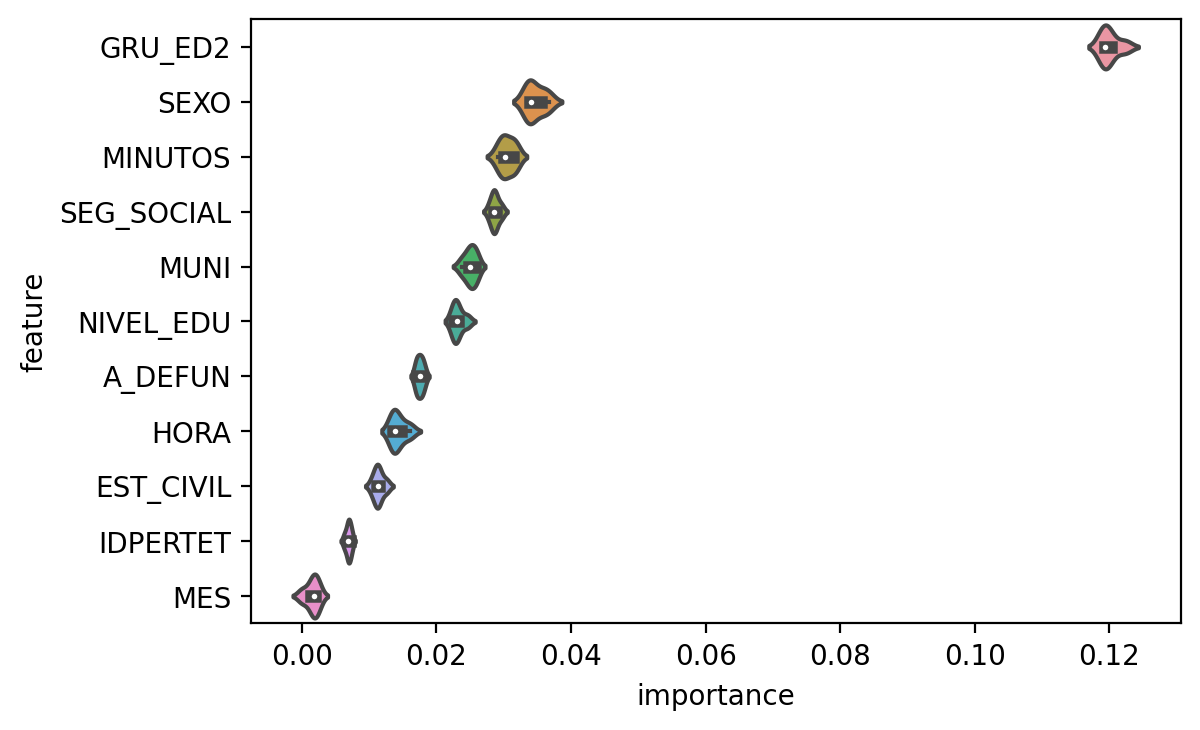
Good. Rather concentrated distributions around the mean/median. This is actually
expected because eli5 avoids re-training the estimator since that can be
computationally intensive.
So far so good. Just one thing. In this specific example, it would be interesting to use a custom scoring metric. Since I am interested in examining which features are important to predict violent deaths, it would be appropriate to compute permutation importance using the class-specific recall rate.
eli5 allows you to pass a “callable object / function with signature
scorer(estimator, X, y)” for the scoring parameter, so it should be rather easy.
However, I just tried and didn’t work immediately and I am not in a mood to
troubleshoot that right now.
But I know mlxtend provides other alternative to compute permutation
importance.
And they also receive a callable object as
the scoring metric “scoring function (e.g., metric=scoring_func) that accepts
two arguments, y_true and y_pred”. So let’s try that.
First calculate and plot the default permutation importance.
from mlxtend.evaluate import feature_importance_permutation

with TicToc():
    mlx_perm_imp, _ = feature_importance_permutation(
        predict_method=rforestclf.predict,
        X=X_test.values,
        y=y_test.values,
        metric='accuracy',
        num_rounds=50,
        seed=0
    )

indices = np.argsort(mlx_perm_imp)[::1]
names = [X_train.columns[i] for i in indices]

import matplotlib.pyplot as plt
plt.figure()
plt.barh(
    y=names,
    width=mlx_perm_imp[indices]
)
plt.show()
Elapsed time is 442.960194 seconds.
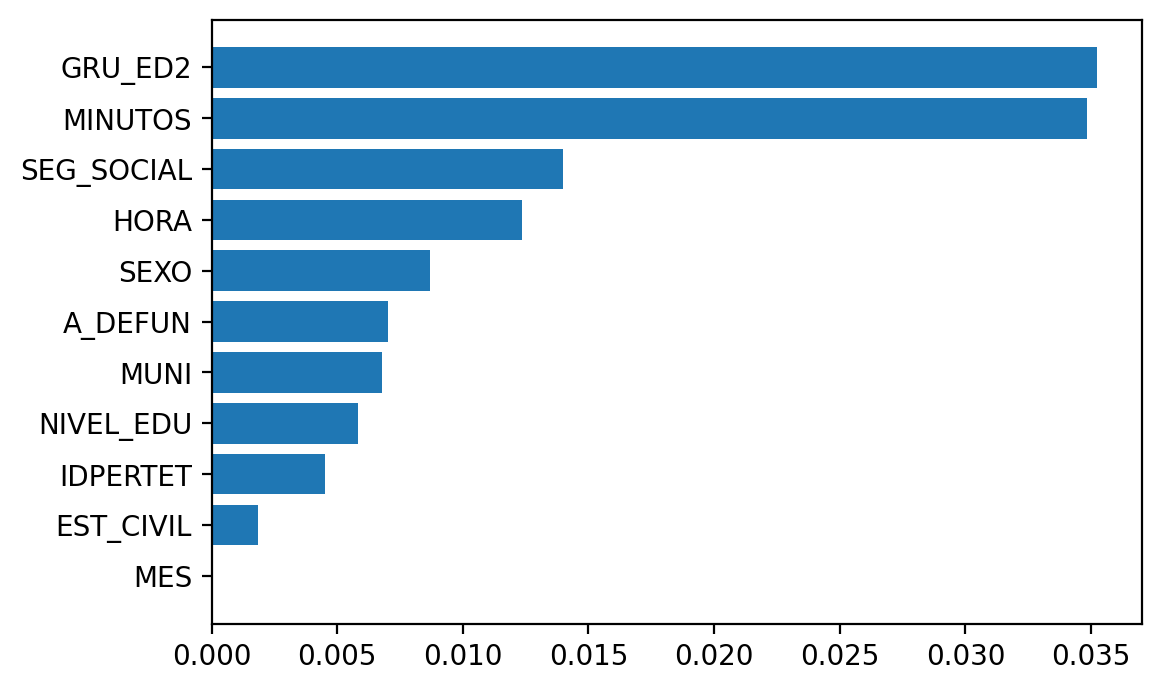
Cool, so it is consistent with eli5’s default using accuracy'.
Now let’s define a simple scorer function, that computes the recall rate for the violent death class.
def violent_scorer(y_true, y_pred):
    return metrics.recall_score(y_true, y_pred, pos_label=2)
# Just to make sure it return the correct value for the y_test and y_pred
violent_scorer(y_test, y_pred)
0.6741346609767662
And now use it to calculate permutation importance.
with TicToc():
    mlx_perm_imp, mlx_perm_imp_all = feature_importance_permutation(
        predict_method=rforestclf.predict,
        X=X_test.values,
        y=y_test.values,
        metric=violent_scorer,
        num_rounds=50,
        seed=0
    )

indices = np.argsort(mlx_perm_imp)[::1]
names = [X_train.columns[i] for i in indices]

import matplotlib.pyplot as plt
plt.figure()
plt.barh(
    y=names,
    width=mlx_perm_imp[indices]
)
plt.show()
Elapsed time is 450.371837 seconds.
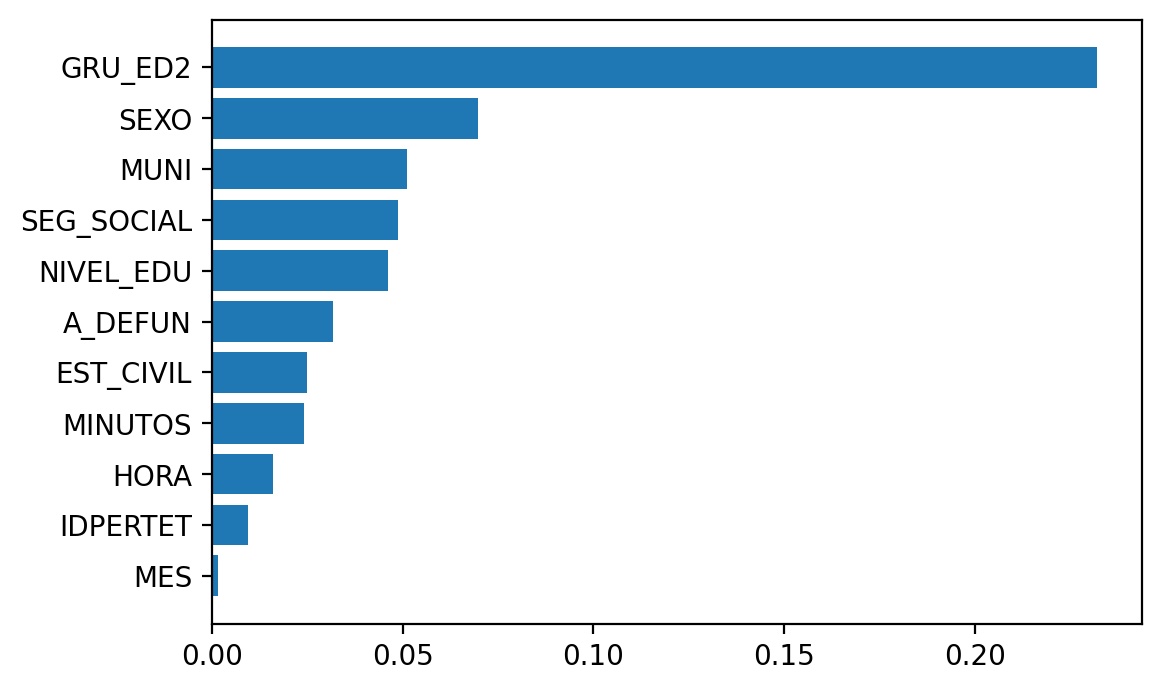
Great, this seems to make sense. Sex, that ended up relegated in the importance calculated using mean decrease impurity now indeed appears quite relevant (but yeah, there are still too many issues to deal with -e.g. check what is going on here with the correlated predictors and how it affects the importance-).
Indeed, once again that may be an issue here. Look at the time of the day the death ocurred. The hour seems unimportant, which is also unintuitive. Violent deaths usually ocurr during the night, right?. So maybe there is a high correlation in there making noise. Let’s take a look.
corr_mat = X_train.corr()
corr_mat.abs().style.background_gradient(cmap='RdBu_r').set_precision(2)
<pandas.io.formats.style.Styler at 0x2cf78b36748>
corr_mat = X_test.corr()
corr_mat.abs().style.background_gradient(cmap='RdBu_r').set_precision(2)
<pandas.io.formats.style.Styler at 0x2cf78fb2d48>
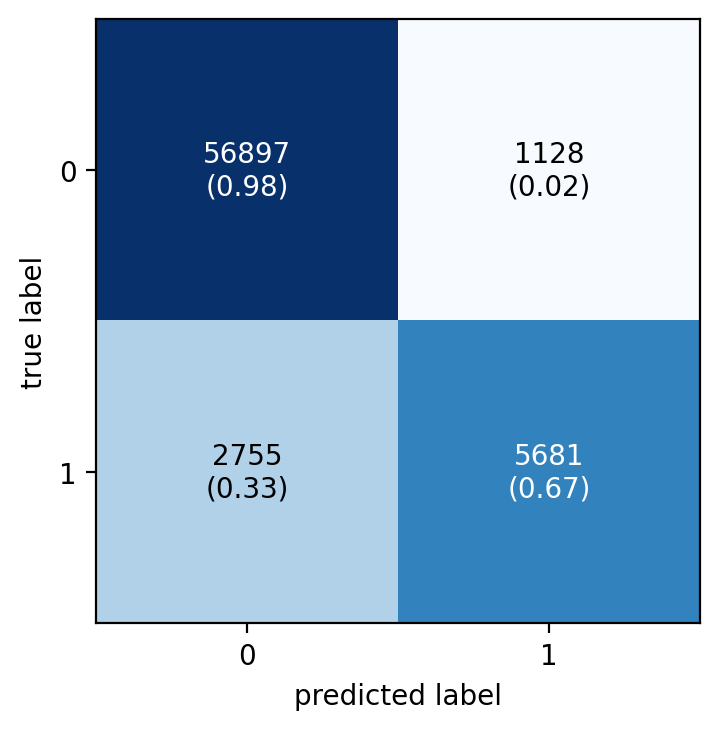
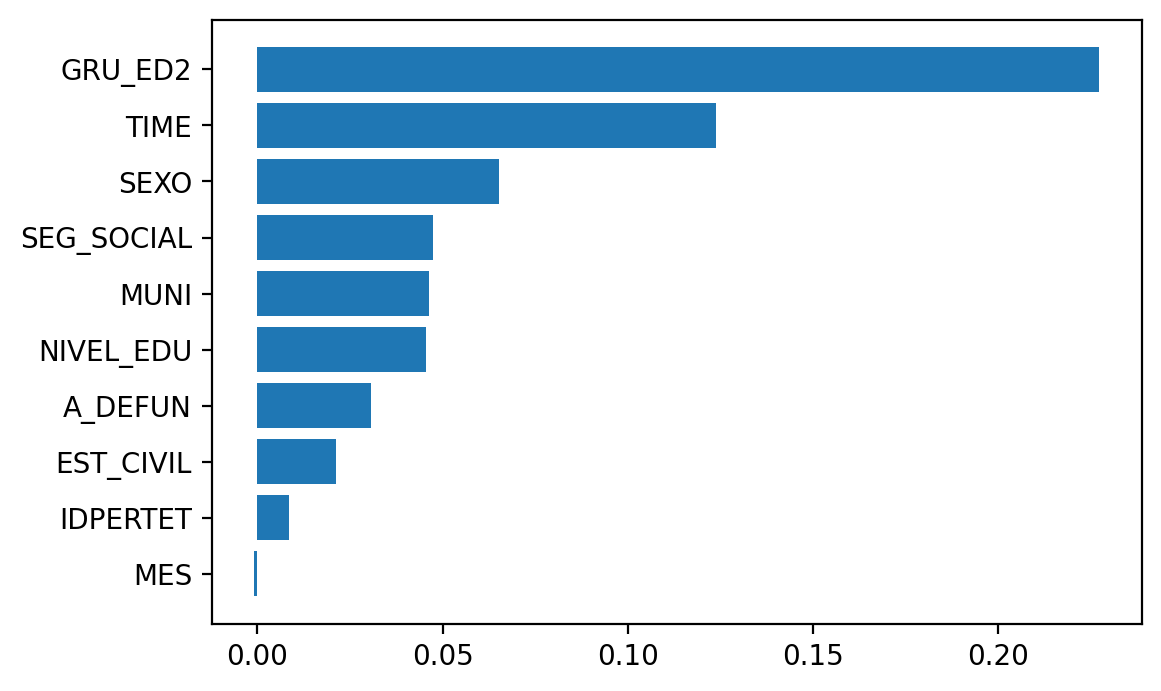
Well, yeah, there is indeed a relatively high correlation between the hour and the minutes. That’s most probably why the hour seems unimportant. Remember that when there are correlated predictors, one of those can take over in the permutation important leaving the other behind. So with this I can start improving the naive model. Let’s just combine hour and minutes in a single variable and re-fit the model.
X_all = deaths_2016.drop("PMAN_MUER", "columns")
X_all["TIME"] = X_all["HORA"]*60 + X_all["MINUTOS"]
X_all = X_all.drop("HORA", "columns")
X_all = X_all.drop("MINUTOS", "columns")
y_all = deaths_2016.loc[:, "PMAN_MUER"]

X_train, X_test, y_train, y_test = train_test_split(
    X_all, y_all, test_size=0.3, random_state=0
)
rforestclf = RandomForestClassifier(n_estimators=100, n_jobs=-1, random_state=0)
with TicToc(): # TicToc just to time it
    rforestclf.fit(X_train, y_train)
with TicToc(): # TicToc just to time it
    y_pred = rforestclf.predict(X_test)

naive_confusion_matrix = metrics.confusion_matrix(y_test, y_pred)
fig, ax = plot_confusion_matrix(
    conf_mat=naive_confusion_matrix,
    show_absolute=True,
    show_normed=True
)
plt.show()
Elapsed time is 9.516456 seconds.
Elapsed time is 0.666135 seconds.
And now calculate the permutation importance.
with TicToc():
    mlx_perm_imp, mlx_perm_imp_all = feature_importance_permutation(
        predict_method=rforestclf.predict,
        X=X_test.values,
        y=y_test.values,
        metric=violent_scorer,
        num_rounds=50,
        seed=0
    )

indices = np.argsort(mlx_perm_imp)[::1]
names = [X_train.columns[i] for i in indices]

plt.figure()
plt.barh(
    y=names,
    width=mlx_perm_imp[indices]
)
plt.show()
Elapsed time is 340.431551 seconds.
So I’ll leave feature importances here and move on to how to deal with class imbalance, …, in the next post.
Session Info
from sinfo import sinfo
from IPython.display import display_markdown
sinfo_html = sinfo(html=True, write_req_file=False)
display_markdown(sinfo_html.data, raw=True)
Click to view module versions
-----
eli5        0.10.1
joypy       0.2.2
matplotlib  3.2.1
mlxtend     0.17.2
numpy       1.18.1
pandas      1.0.3
pytictoc    1.4.0
scikitplot  0.3.7
seaborn     0.10.0
sinfo       0.3.1
sklearn     0.22.2.post1
-----
Click to view dependency modules
attr                19.3.0
backcall            0.1.0
colorama            0.4.3
concurrent          NA
cycler              0.10.0
cython_runtime      NA
dateutil            2.8.1
decorator           4.4.2
defusedxml          0.6.0
eli5                0.10.1
encodings           NA
entrypoints         0.3
genericpath         NA
graphviz            0.13.2
importlib_metadata  1.6.0
ipykernel           5.2.0
ipython_genutils    0.2.0
ipywidgets          7.5.1
jedi                0.15.2
jinja2              2.11.1
joblib              0.14.1
joypy               0.2.2
jsonschema          3.2.0
kiwisolver          1.2.0
markupsafe          1.1.1
matplotlib          3.2.1
mistune             0.8.4
mlxtend             0.17.2
mpl_toolkits        NA
nbconvert           5.6.1
nbformat            5.0.4
nt                  NA
ntpath              NA
nturl2path          NA
numpy               1.18.1
opcode              NA
pandas              1.0.3
pandocfilters       NA
parso               0.6.2
pickleshare         0.7.5
posixpath           NA
prompt_toolkit      3.0.5
pvectorc            NA
pweave              0.30.3
pydoc_data          NA
pyexpat             NA
pygments            2.6.1
pyparsing           2.4.7
pyrsistent          NA
pytz                2019.3
scikitplot          0.3.7
scipy               1.3.1
seaborn             0.10.0
sinfo               0.3.1
six                 1.14.0
sklearn             0.22.2.post1
sre_compile         NA
sre_constants       NA
sre_parse           NA
statsmodels         0.11.1
testpath            0.4.4
tornado             6.0.4
traitlets           4.3.3
wcwidth             NA
zipp                NA
zmq                 19.0.0
-----
IPython             7.13.0
jupyter_client      6.1.2
jupyter_core        4.6.3
notebook            6.0.3
-----
Python 3.7.6 | packaged by conda-forge | (default, Mar 23 2020, 22:22:21) [MSC v.1916 64 bit (AMD64)]
Windows-10-10.0.18362-SP0
4 logical CPU cores, Intel64 Family 6 Model 142 Stepping 9, GenuineIntel
-----
Session information updated at 2020-04-16 22:50